Monocle2 Analysis
Preface
TIP
Monocle2 is one of the most widely used pseudotime analysis tools in the field of single-cell transcriptomics. It helps researchers reconstruct continuous trajectories of cells during dynamic biological processes such as development, differentiation, or disease progression, revealing key regulatory mechanisms underlying cell fate decisions.
In single-cell studies, the cell states we observe are often heterogeneous and asynchronous. For example, within a cell population captured at the same time point, some cells may be in the early stages of differentiation, while others are nearing terminal states. Pseudotime analysis uses bioinformatics algorithms to order these static cell snapshots according to their inherent developmental processes, thereby constructing one or more continuous cell differentiation trajectories.
Core Functions of Monocle2
- Cell Trajectory Construction: Reconstructs the transition paths of cells from one state to another, especially suitable for analyzing complex processes involving multiple branches (i.e., cell fate decision points).
- Gene Dynamic Change Analysis: Identifies genes with significant expression pattern changes along pseudotime trajectories, discovering key regulatory factors driving cell state transitions.
- Cell State Definition: Based on trajectories, cells are divided into different developmental stages (States), and these stages are functionally characterized.
This document aims to provide a comprehensive technical guide for single-cell researchers on Monocle2, covering its basic principles, operation methods on the SeekSoul™ Online platform, result interpretation, practical cases, and frequently asked questions, helping you quickly master and apply this tool.
Theoretical Foundations of Monocle2
Core Principles
The core idea of Monocle2 is: If we can find a set of genes that represent the dynamic development process of cells, we can arrange these cells in a low-dimensional space according to the expression patterns of these genes in each cell, thereby reconstructing their dynamic change trajectory. This process can be summarized in three steps:
Monocle2's trajectory inference mainly relies on the DDRTree (Discriminative Dimensionality Reduction via learning a Tree) algorithm. Its core ideas can be decomposed into three main steps:
Selecting Ordering Genes: First, we need to select a set of genes that are differentially expressed between different cell states. The expression changes of these genes can represent the biological processes in which cells are located. Monocle2 provides multiple selection strategies, the most commonly used being to select genes with high expression variation between cells.
Dimensionality Reduction: Using the selected ordering genes, Monocle2 performs dimensionality reduction using the DDRTree algorithm. This algorithm not only reduces data dimensionality but also simultaneously learns a "Principal Graph" that can describe the intrinsic structure of the data, which serves as the basis for subsequent trajectory construction.
Placing Cells on the Trajectory: Each cell is projected onto the learned principal graph, thereby determining its position on the trajectory and calculating pseudotime values. The algorithm finds the longest path in the graph as the "backbone" and identifies possible branch points and different cell fate endpoints based on this.
Key Algorithm: DDRTree
DDRTree is one of the key differences between Monocle2 and earlier versions of Monocle as well as other pseudotime analysis tools (such as TSCAN). It is a "Reversed Graph Embedding" method, with advantages including:
- Simultaneous Dimensionality Reduction and Clustering: While reducing dimensionality, cells are clustered onto nodes of the graph.
- Robust Trajectory Construction: It can effectively learn complex biological trajectories, especially those containing multiple branch points.
- Result Stability: Compared to methods based on Minimum Spanning Tree (MST), DDRTree is less sensitive to noise and outliers in the data.
TIP
Understanding DDRTree is key to mastering Monocle2. It fits high-dimensional gene expression data by constructing a "tree-like" low-dimensional structure, where the trunk and branches of this "tree" form the cell differentiation trajectory we ultimately see.
SeekSoul™ Online Platform Operation Guide
On the SeekSoul™ Online platform, the Monocle2 analysis process is designed to be intuitive and easy to use. You don't need to write code; you can complete the analysis simply through the parameter configuration interface.
Preparation Before Analysis
TIP
The success of Monocle2 analysis largely depends on the quality of input data and the rationality of biological questions. Before starting the analysis, please be sure to confirm:
- Data has been preprocessed: Your single-cell data has undergone standard quality control, dimensionality reduction, clustering, and cell type annotation.
- Appropriate cell subpopulations have been selected: Pseudotime analysis should be performed on cell subpopulations with potential differentiation or transformation relationships. For example, analyze different subtypes of T cells or progenitor cells at different differentiation stages. It is meaningless to perform analysis on biologically unrelated cells (such as T cells and epithelial cells) together.
- Biological starting point is clear: Although Monocle2 can automatically infer the starting point of the trajectory, if your research has a clear biological starting point (such as stem cells, naive T cells, etc.), understanding this will help with subsequent result interpretation.
Parameter Details
The following table details the main parameters and their descriptions for the Monocle2 analysis module on the SeekSoul™ Online platform.
| Interface Parameter | Description |
|---|---|
| Task Name | The name of this analysis task, must start with an English letter. |
| Group.by | Select the label corresponding to the cell type or cluster to be analyzed, for example, celltype. |
| Cell Type | Multiple selection, select specific cell types or clusters to include in the analysis. |
| Filter by | Select labels used to filter samples or groups, for example, Sample. |
| Filter | Multiple selection, select samples or groups to retain. |
| Split.by | Multiple selection, labels used to split different groups when plotting, such as Group or Sample. |
| Species | Select the species corresponding to your data. |
| Sorted Genes | Select gene set strategy for constructing trajectories. |
a. dispersion | Highly variable genes (default). Selected based on gene expression dispersion, no prior knowledge required. |
b. differential | Differential genes. Selected based on differentially expressed genes between different cell populations. |
c. genelist | Custom genes. Upload your own defined gene list. |
| Mean_expression | dispersion mode parameter, average expression threshold for highly variable genes. |
| Dispersion_empirical | dispersion mode parameter, empirical dispersion threshold. |
| Min_expr | differential mode parameter, minimum expression threshold for differential genes. |
| Qval | differential mode parameter, q-value (FDR) threshold for differential genes. |
| Custom Differentially Expressed Gene Sets | genelist mode parameter, click [Download Template], upload gene list file according to template format. |
| Downsample | Whether to perform random downsampling on large datasets. |
| Downsample_num | Number of cells to retain for each cell subpopulation after downsampling. |
| Analysis Based on Historical Results | Select "Modify root" to re-specify the starting point based on completed analysis tasks. |
| Historical Task Name | Select a successfully completed Monocle2 task. |
| root | In historical task results, select a new cell state (State) as the starting point. |
| Note | Custom remark information. |
Important Notes
TIP
- Processing large datasets: When the total number of cells exceeds tens of thousands, if the
Downsampleparameter is set toFalse, the analysis may fail due to insufficient memory. It is strongly recommended to enableDownsamplefor analysis. - Metadata specification: Please ensure that the metadata column names and content in the RDS file do not contain Chinese characters or special characters (such as
&), otherwise it may cause process errors.
Operation Process
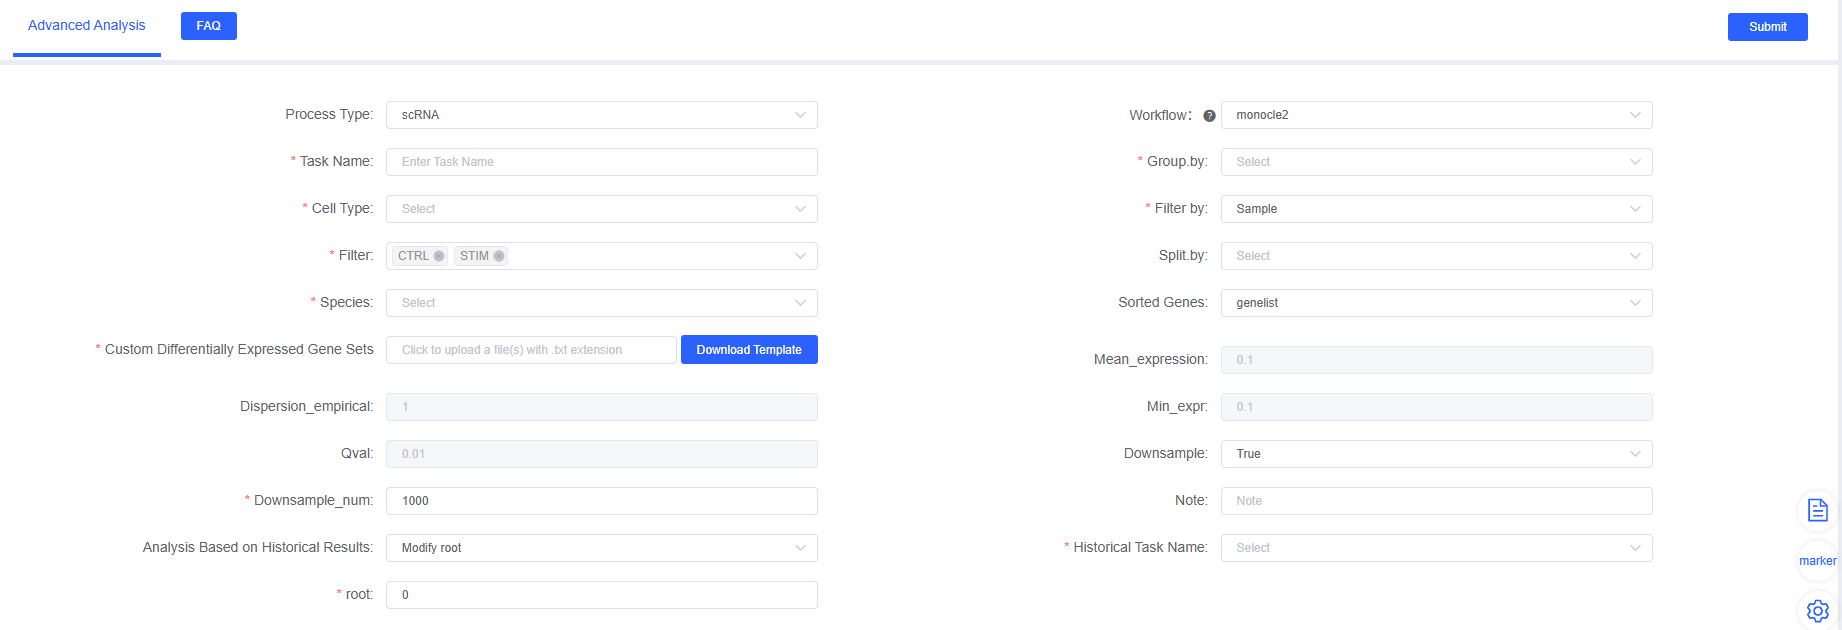
- Enter the analysis module: Navigate to the "Advanced Analysis" module on the SeekSoul™ Online platform and select "monocle2".
- Create a new task: Name your analysis task and select the samples or project to analyze.
- Configure parameters: According to the above guidelines, select cell types, grouping information, etc.
- Submit the task: After confirming the parameters are correct, click the "Submit" button and wait for the analysis to complete.
- Download and view: After the analysis is completed, download and view the generated analysis report and result files in the task list.
Result Interpretation
The analysis report of Monocle2 contains rich charts and data files. The following is a detailed interpretation of the core results.
Cell Trajectory Overview
This is the most core and intuitive result of Monocle2 analysis. It displays all cells in a two-dimensional space, connected by lines into a tree-like structure, representing the developmental trajectory of cells.
Pseudotime Distribution Map
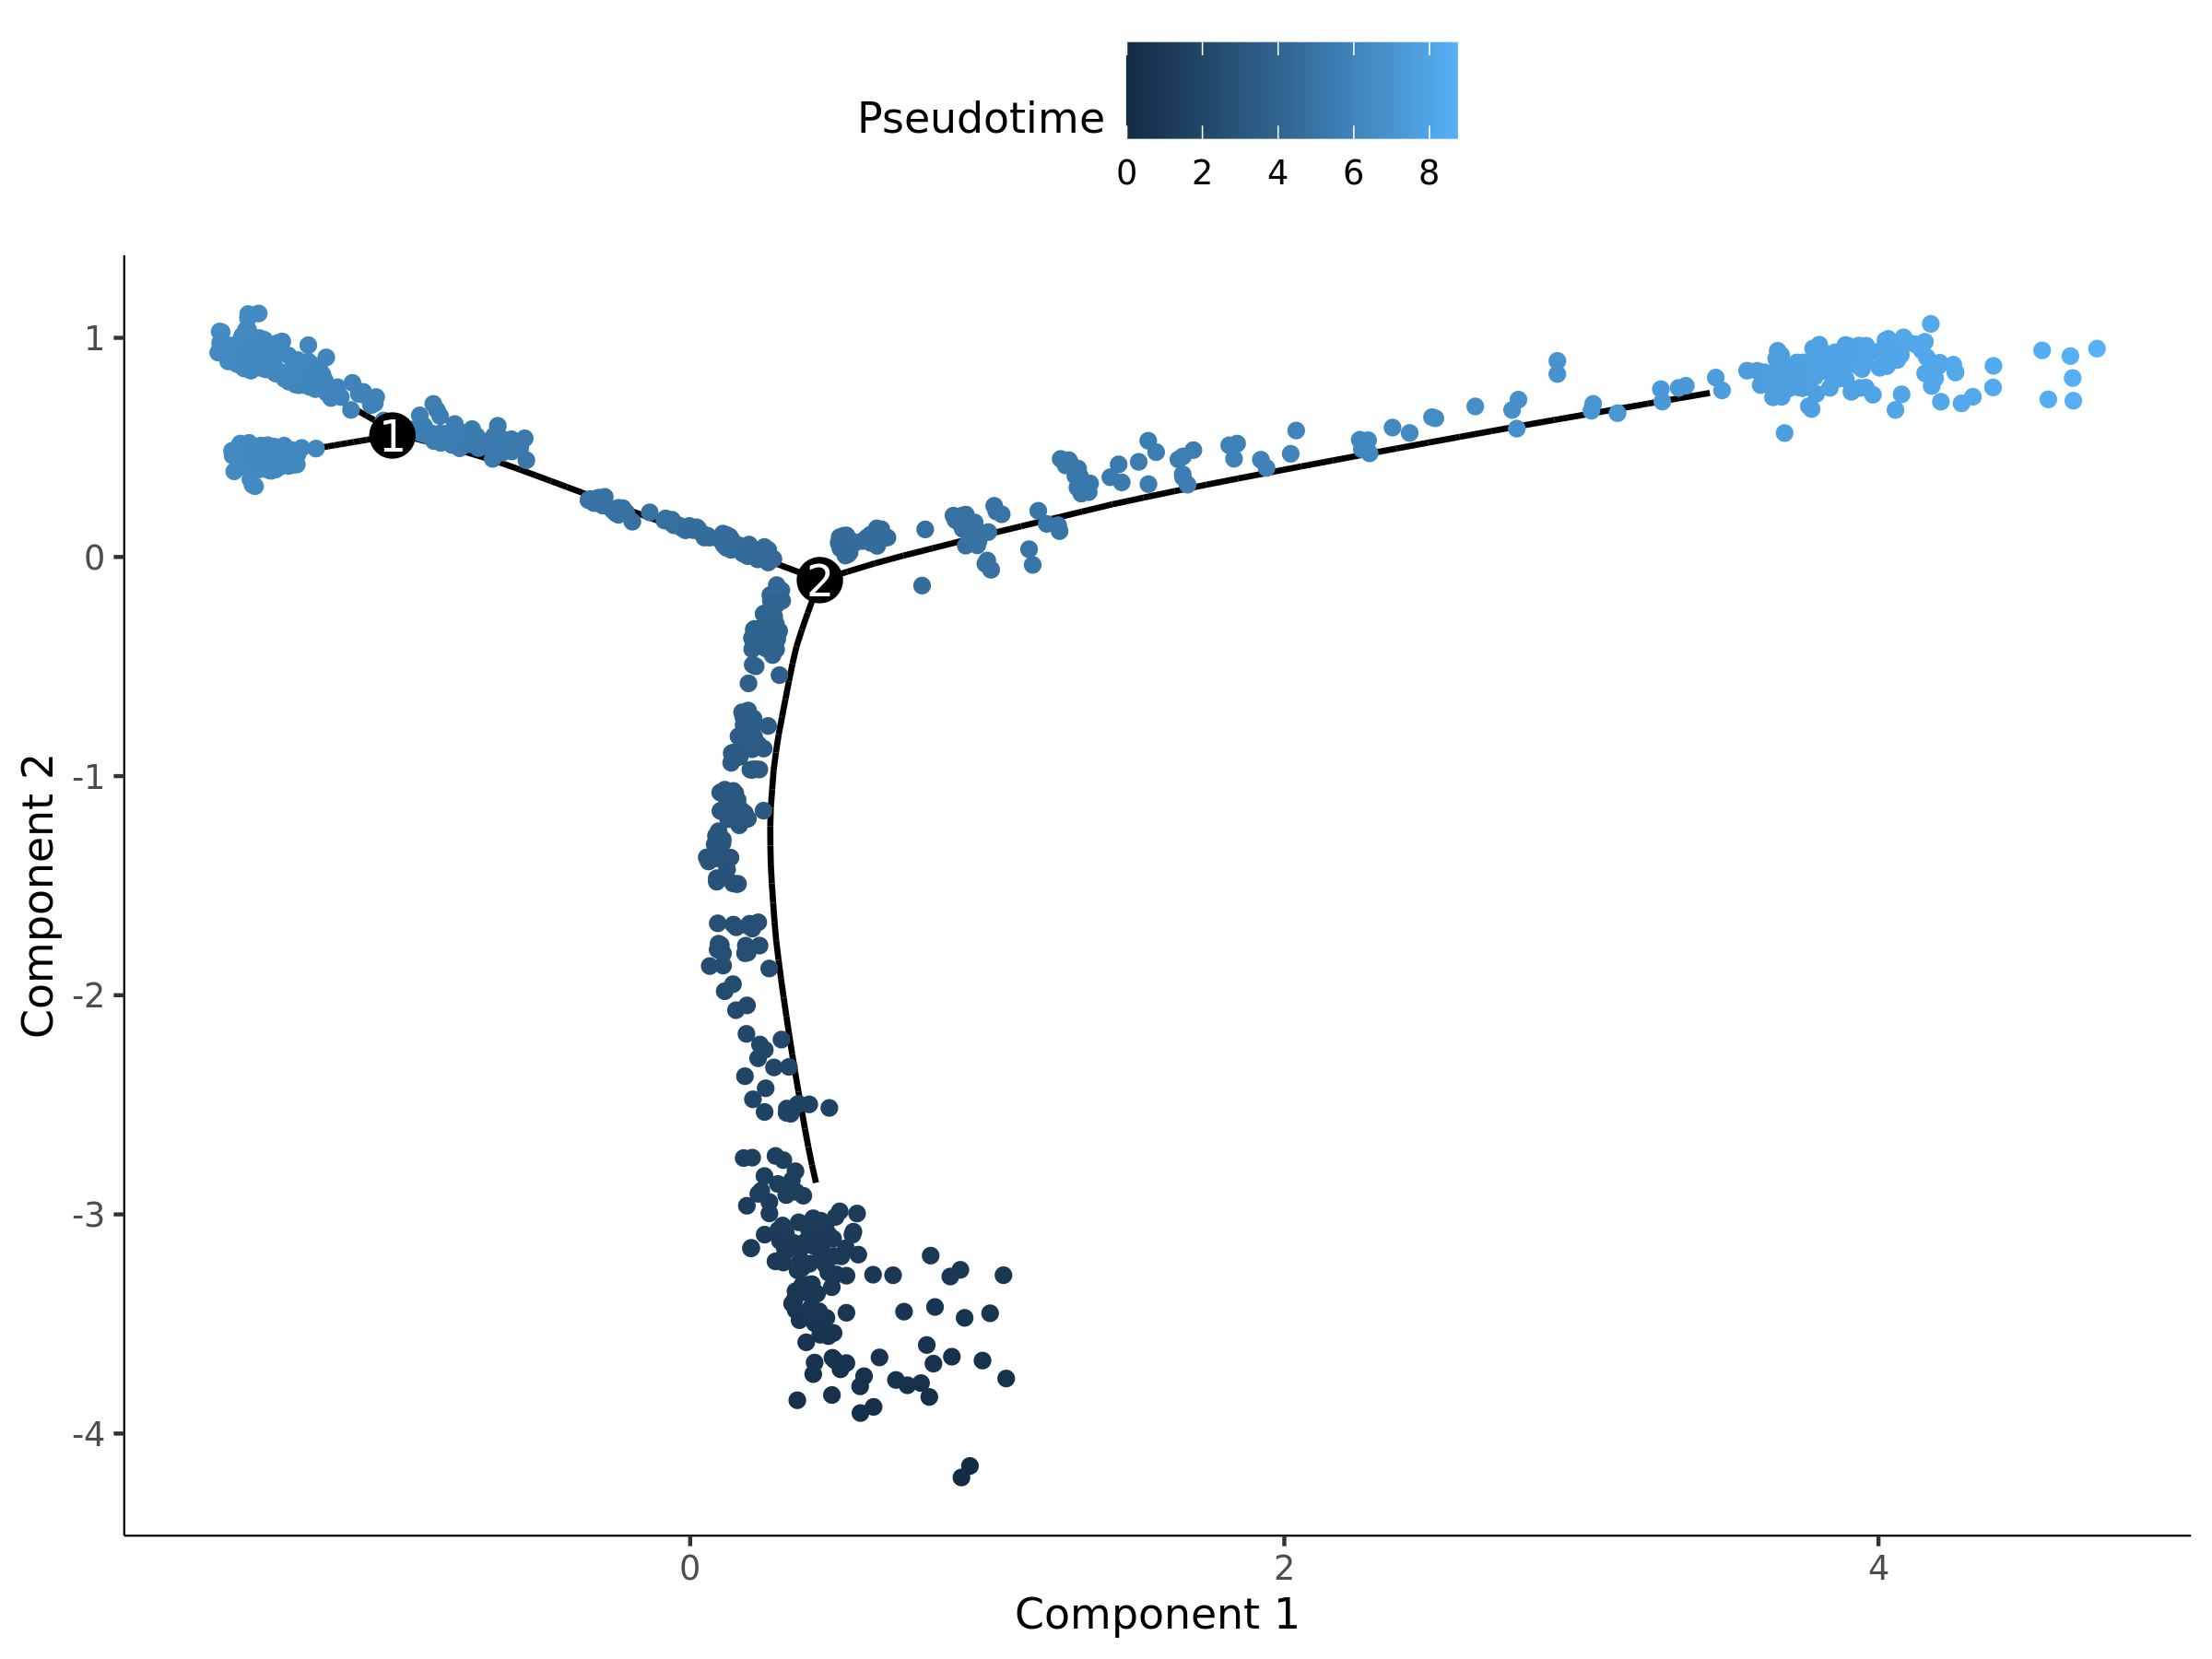
- Chart Interpretation: Each point represents a cell. The color represents the pseudotime value of the cell, usually gradient from blue (early) to yellow (late). A smaller pseudotime value means the cell is closer to the developmental starting point; a larger value means it is closer to the end point.
- Analysis Points:
- Observe the overall shape of the trajectory: Is it linear unidirectional differentiation, or multi-fate decision containing branch points?
- Identify starting points and end points: The darkest area is usually the starting point of the trajectory.
State Distribution Map
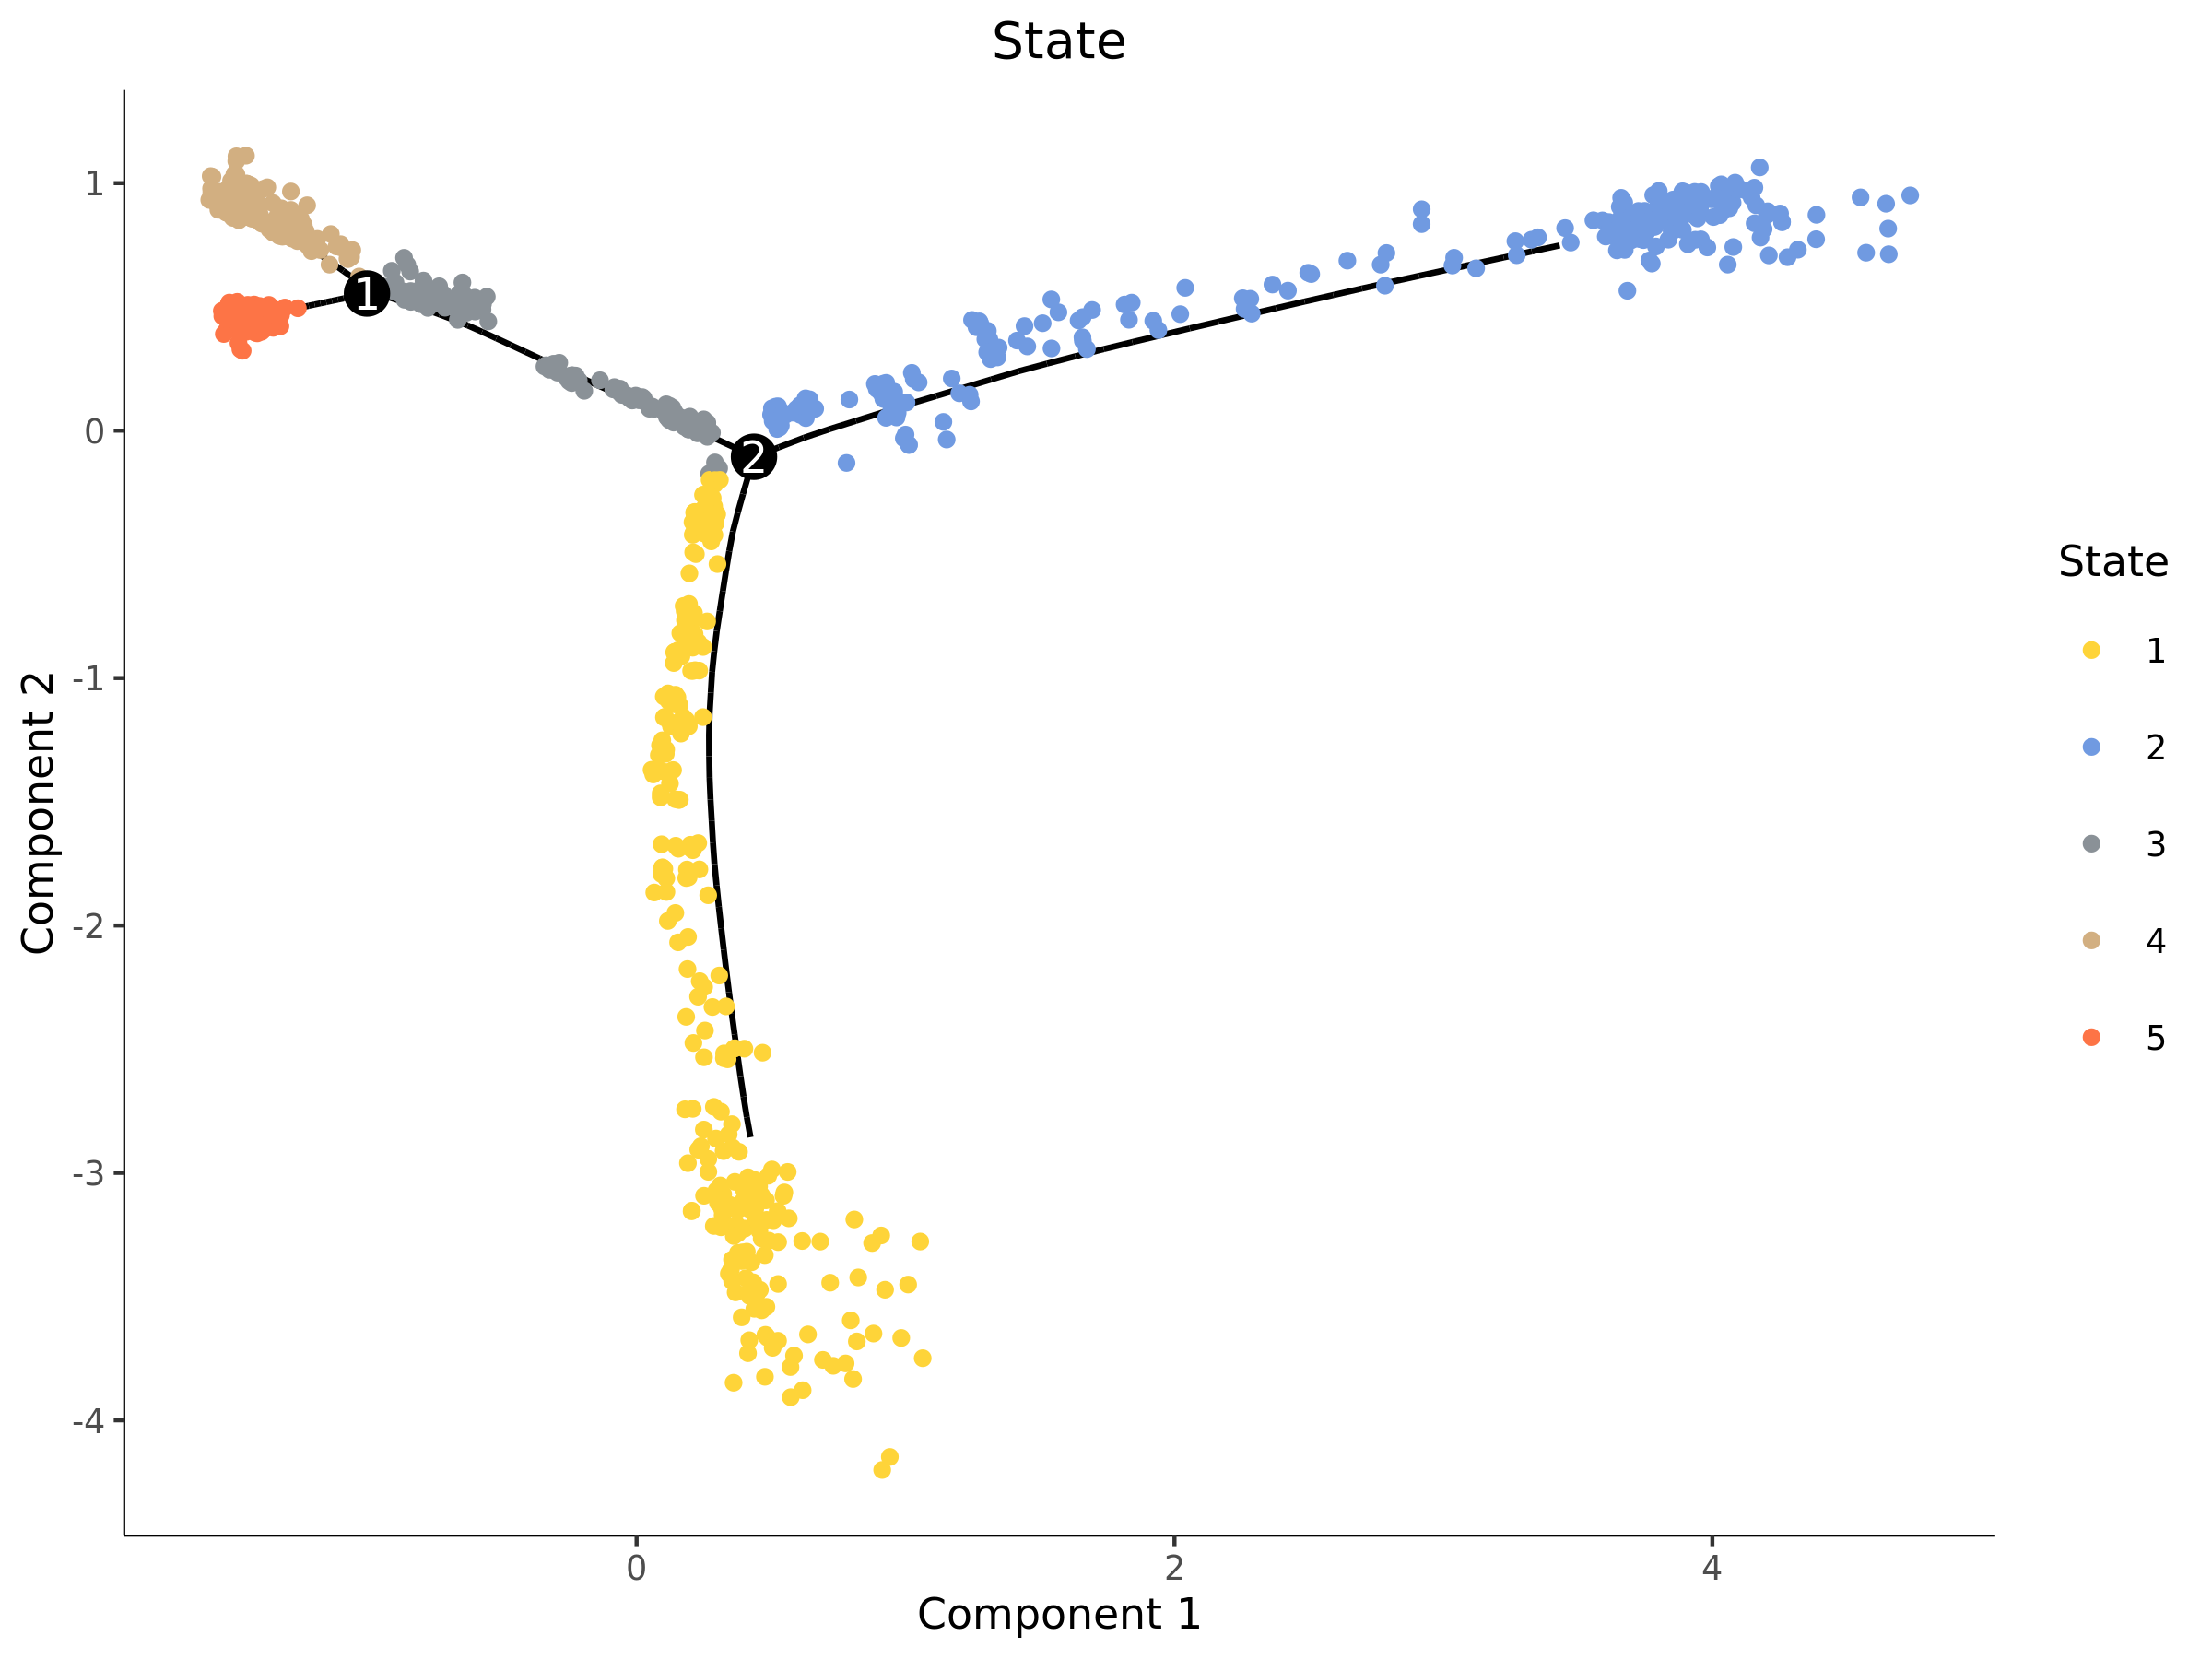
- Chart Interpretation: Monocle2 will divide cells on the trajectory into different "states" (States), which can be understood as different stages of cells during development. Different colors represent different States in the figure.
- Analysis Points:
- The distribution of State is closely related to trajectory branches. A branch point usually connects a "precursor" State and two or more "progeny" States.
- Combined with subsequent gene expression analysis, the functional characteristics of each State can be explored.
Cell Group (celltype) Distribution Map
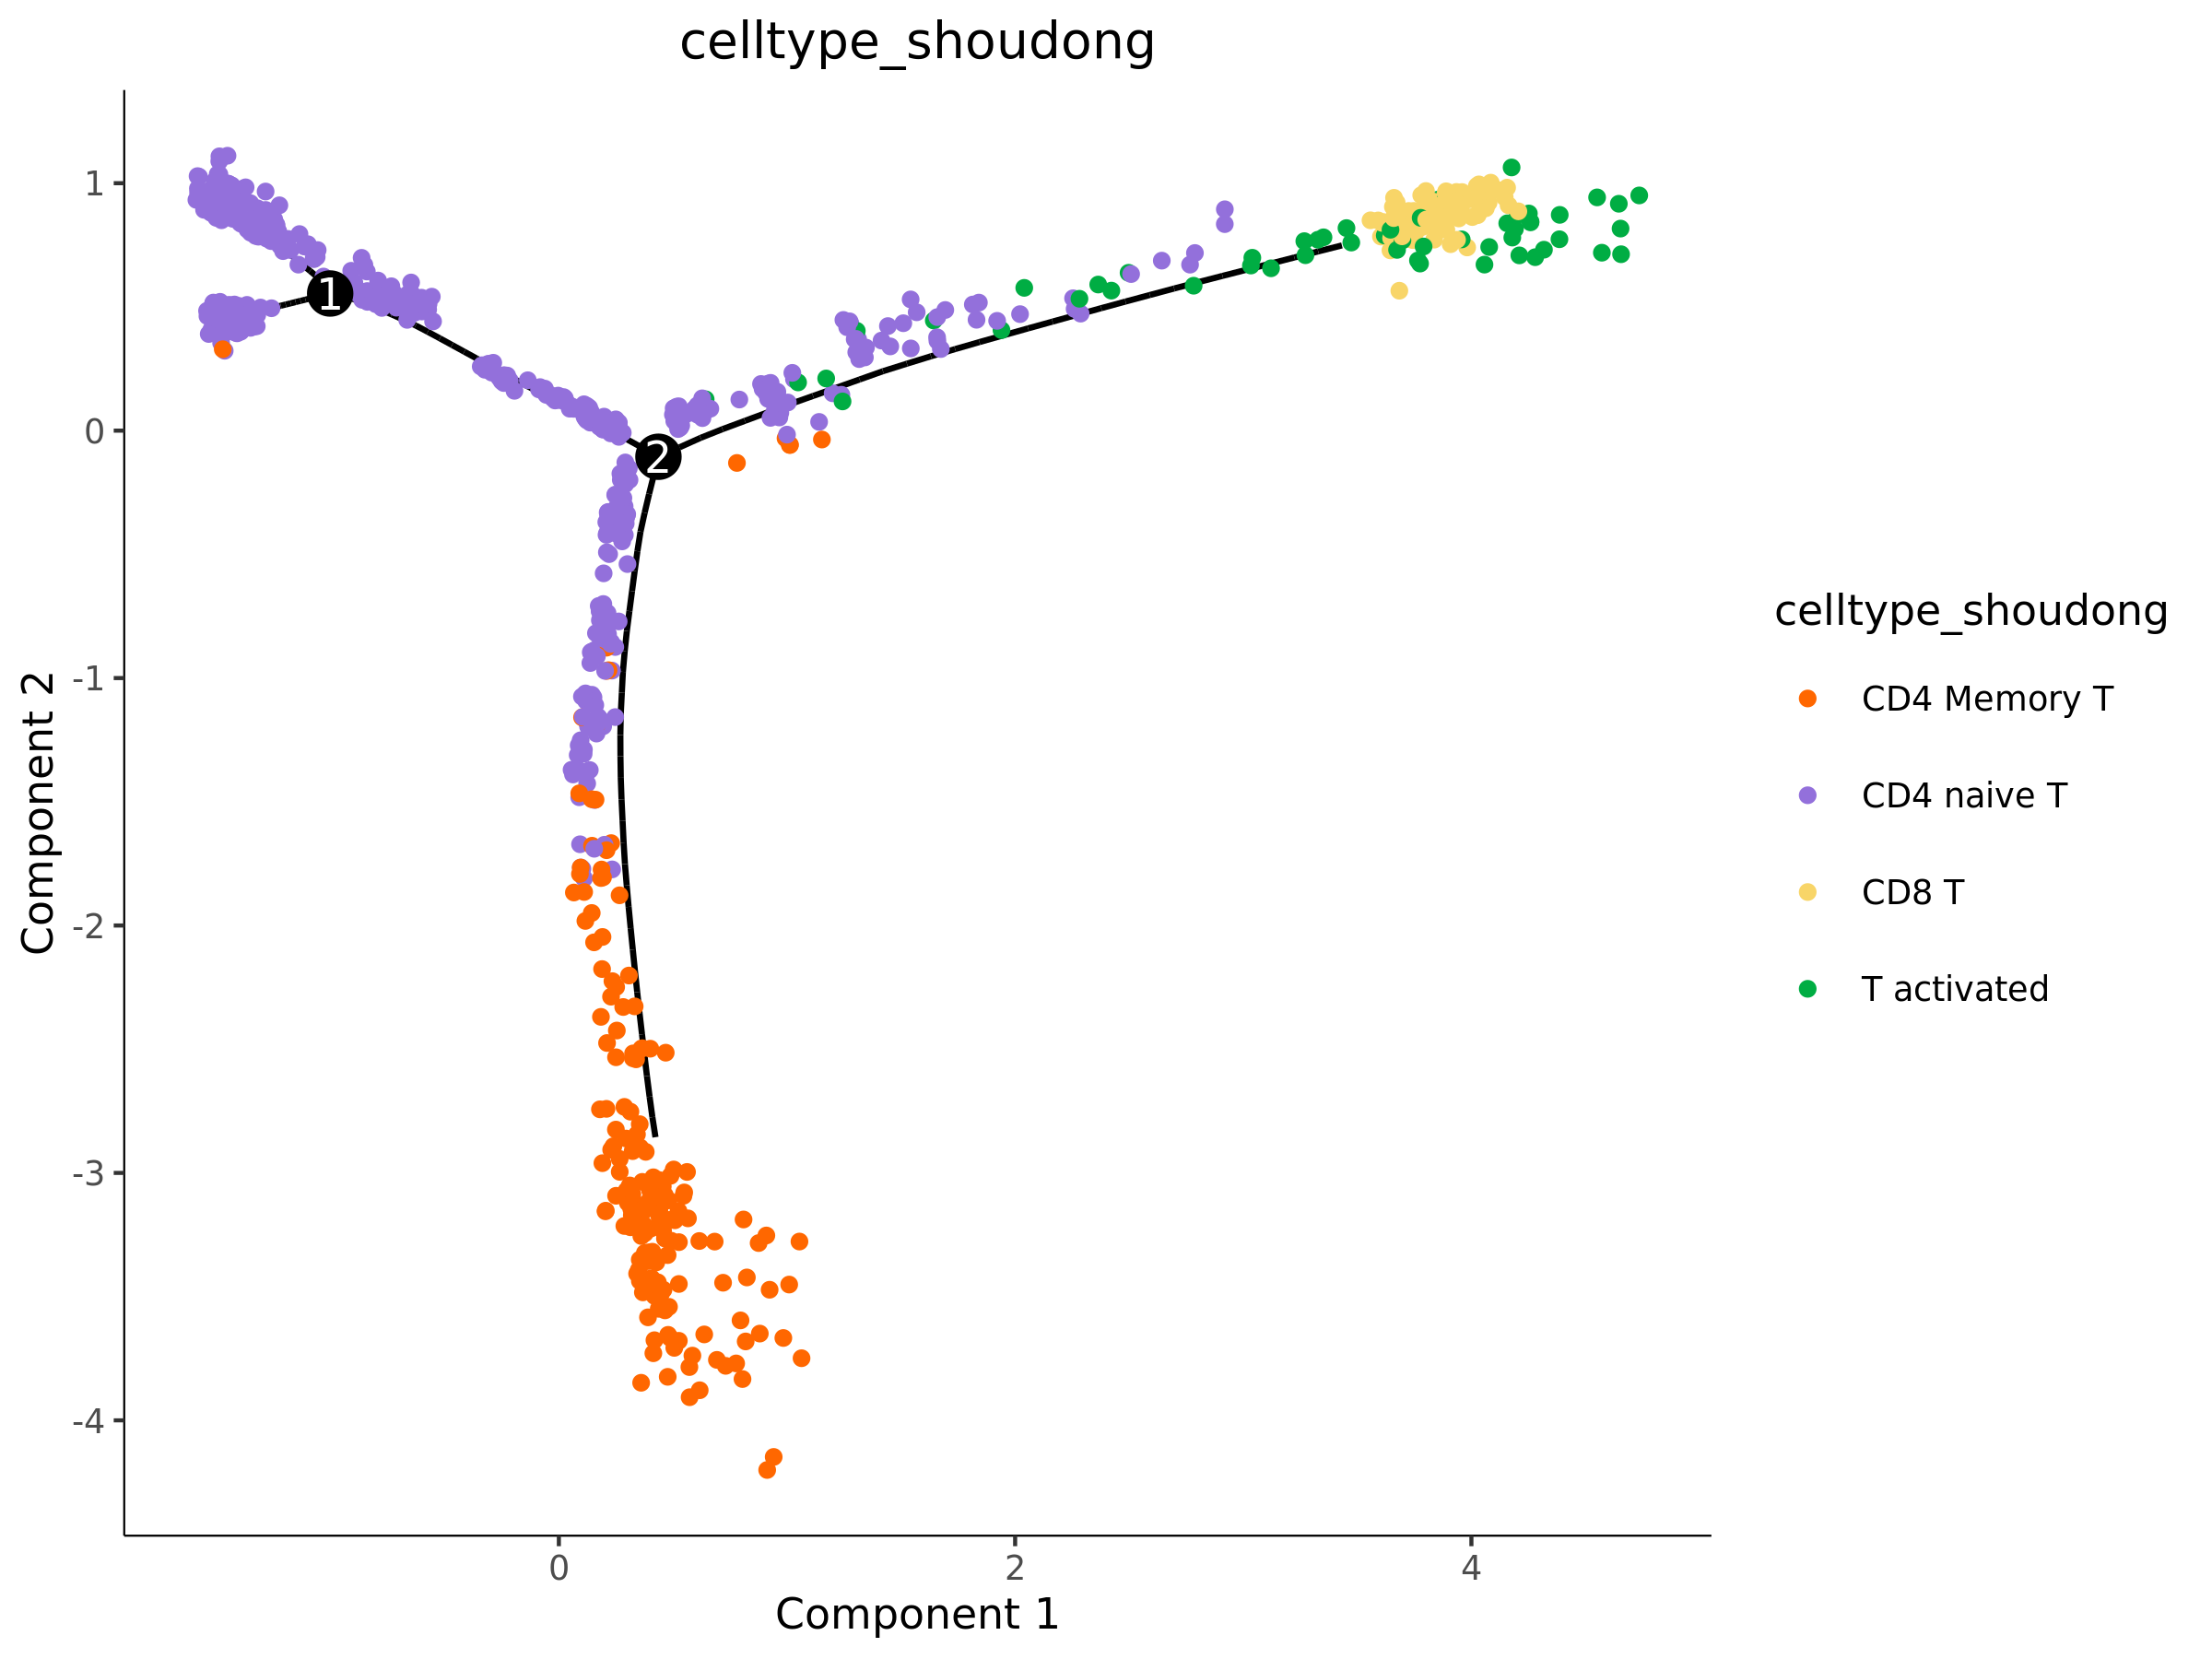
- Chart Interpretation: This is crucially important. It maps your pre-annotated cell types to the trajectory, represented by different colors.
- Analysis Points:
- Verify the biological significance of the trajectory: Check whether the distribution of cell types conforms to known biological processes. For example, are stem cells located at the starting point? Are terminally differentiated cells located at the end of the trajectory?
- Determine differentiation direction: By observing the continuous arrangement of cell types, you can infer the direction and path of differentiation.
- Identify transitional cells: Cells located at the junction of different cell type clusters may be intermediate cells in the state transition process.
TIP
The report usually also provides trajectory maps and cell density maps split by cell type, sample, or State, which help to more clearly observe the distribution and enrichment of specific cell populations on the trajectory.
Genes Changing with Pseudotime
Finding genes that dynamically change on the trajectory is another core goal of pseudotime analysis.
Core Gene Expression Heatmap
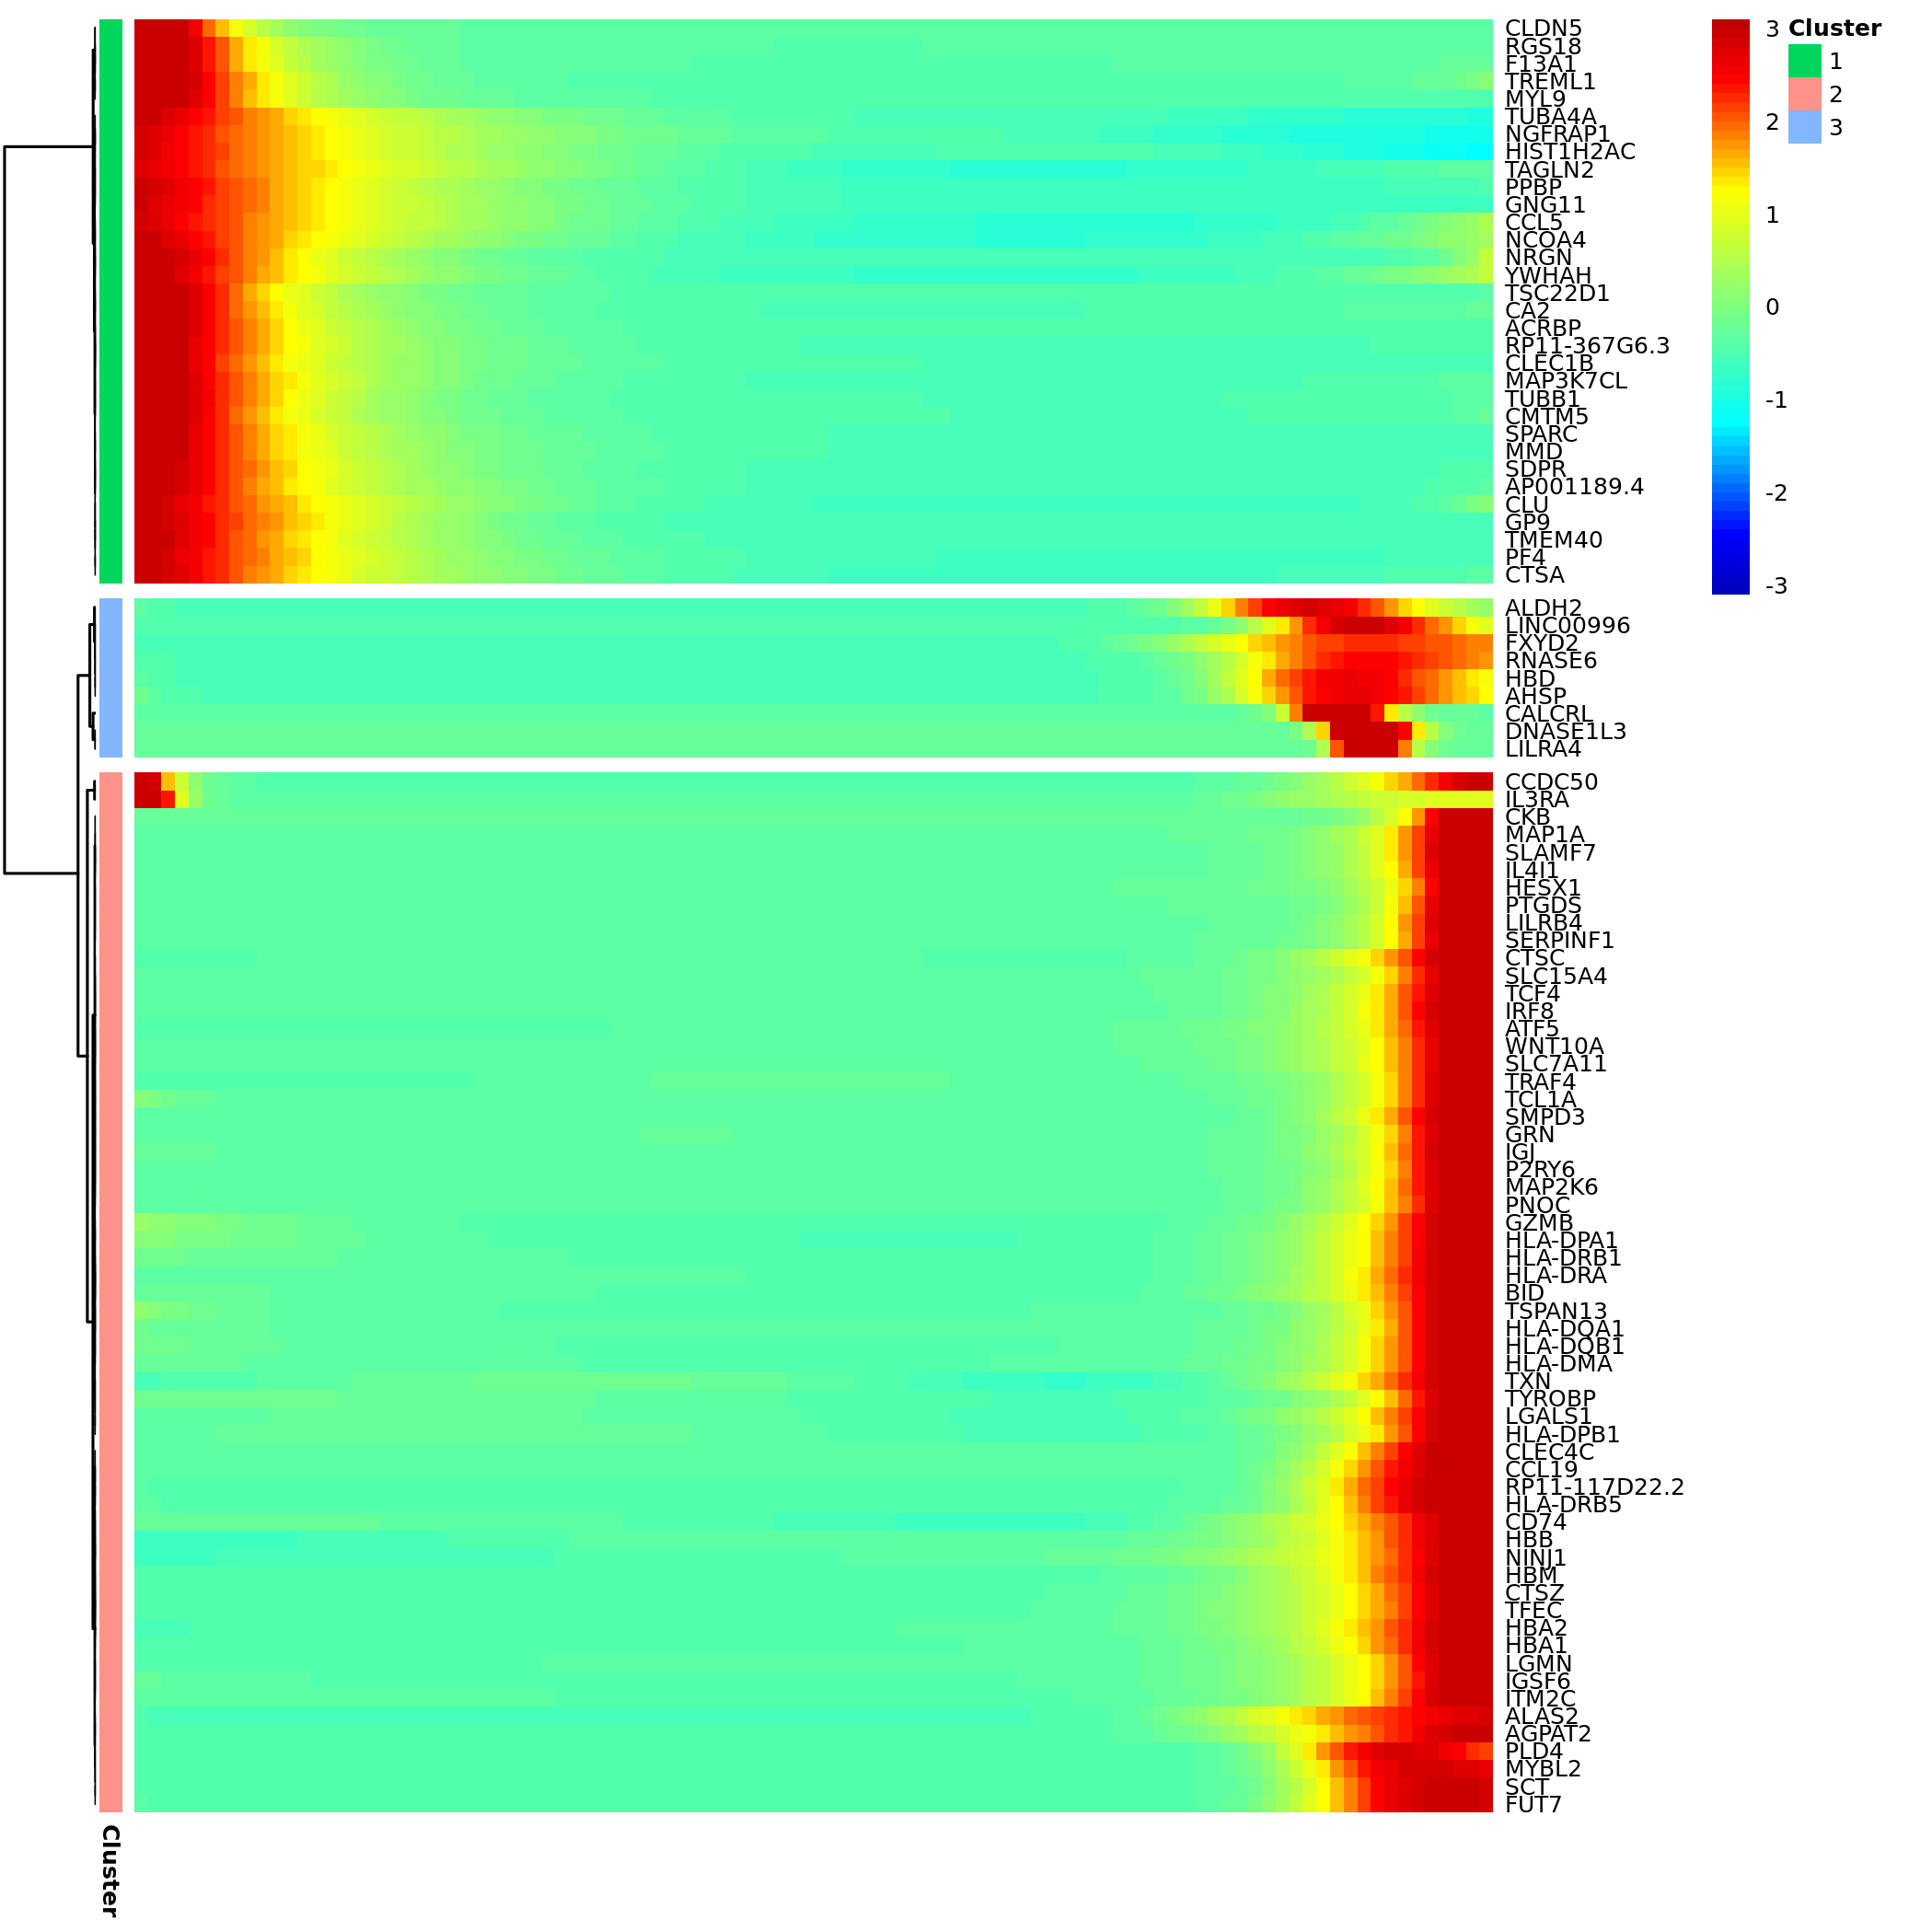
- Chart Interpretation: The heatmap shows a set of genes with the most significant expression changes along pseudotime (usually sorted by q-value).
- Columns: Represent individual cells sorted by pseudotime, from left (early) to right (late).
- Rows: Represent genes.
- Colors: Red indicates high expression, blue indicates low expression.
- Gene Clustering: The clustering tree on the left clusters genes with similar expression patterns together, which may be involved in common biological functions.
- Analysis Points:
- Identify different gene expression patterns, such as genes highly expressed in early development and downregulated in late stages (possibly related to stemness maintenance), or genes gradually upregulated in late development (possibly related to terminal differentiation functions).
- Pay attention to genes with dramatic expression changes near branch points; they may be "switch" genes for cell fate decisions.
Branch Point Analysis (BEAM)
If your trajectory contains branch points, Monocle2 will perform BEAM (Branched Expression Analysis Modeling) analysis to specifically find key genes that play a role when cells "make choices".
Branch Node Gene Expression Heatmap
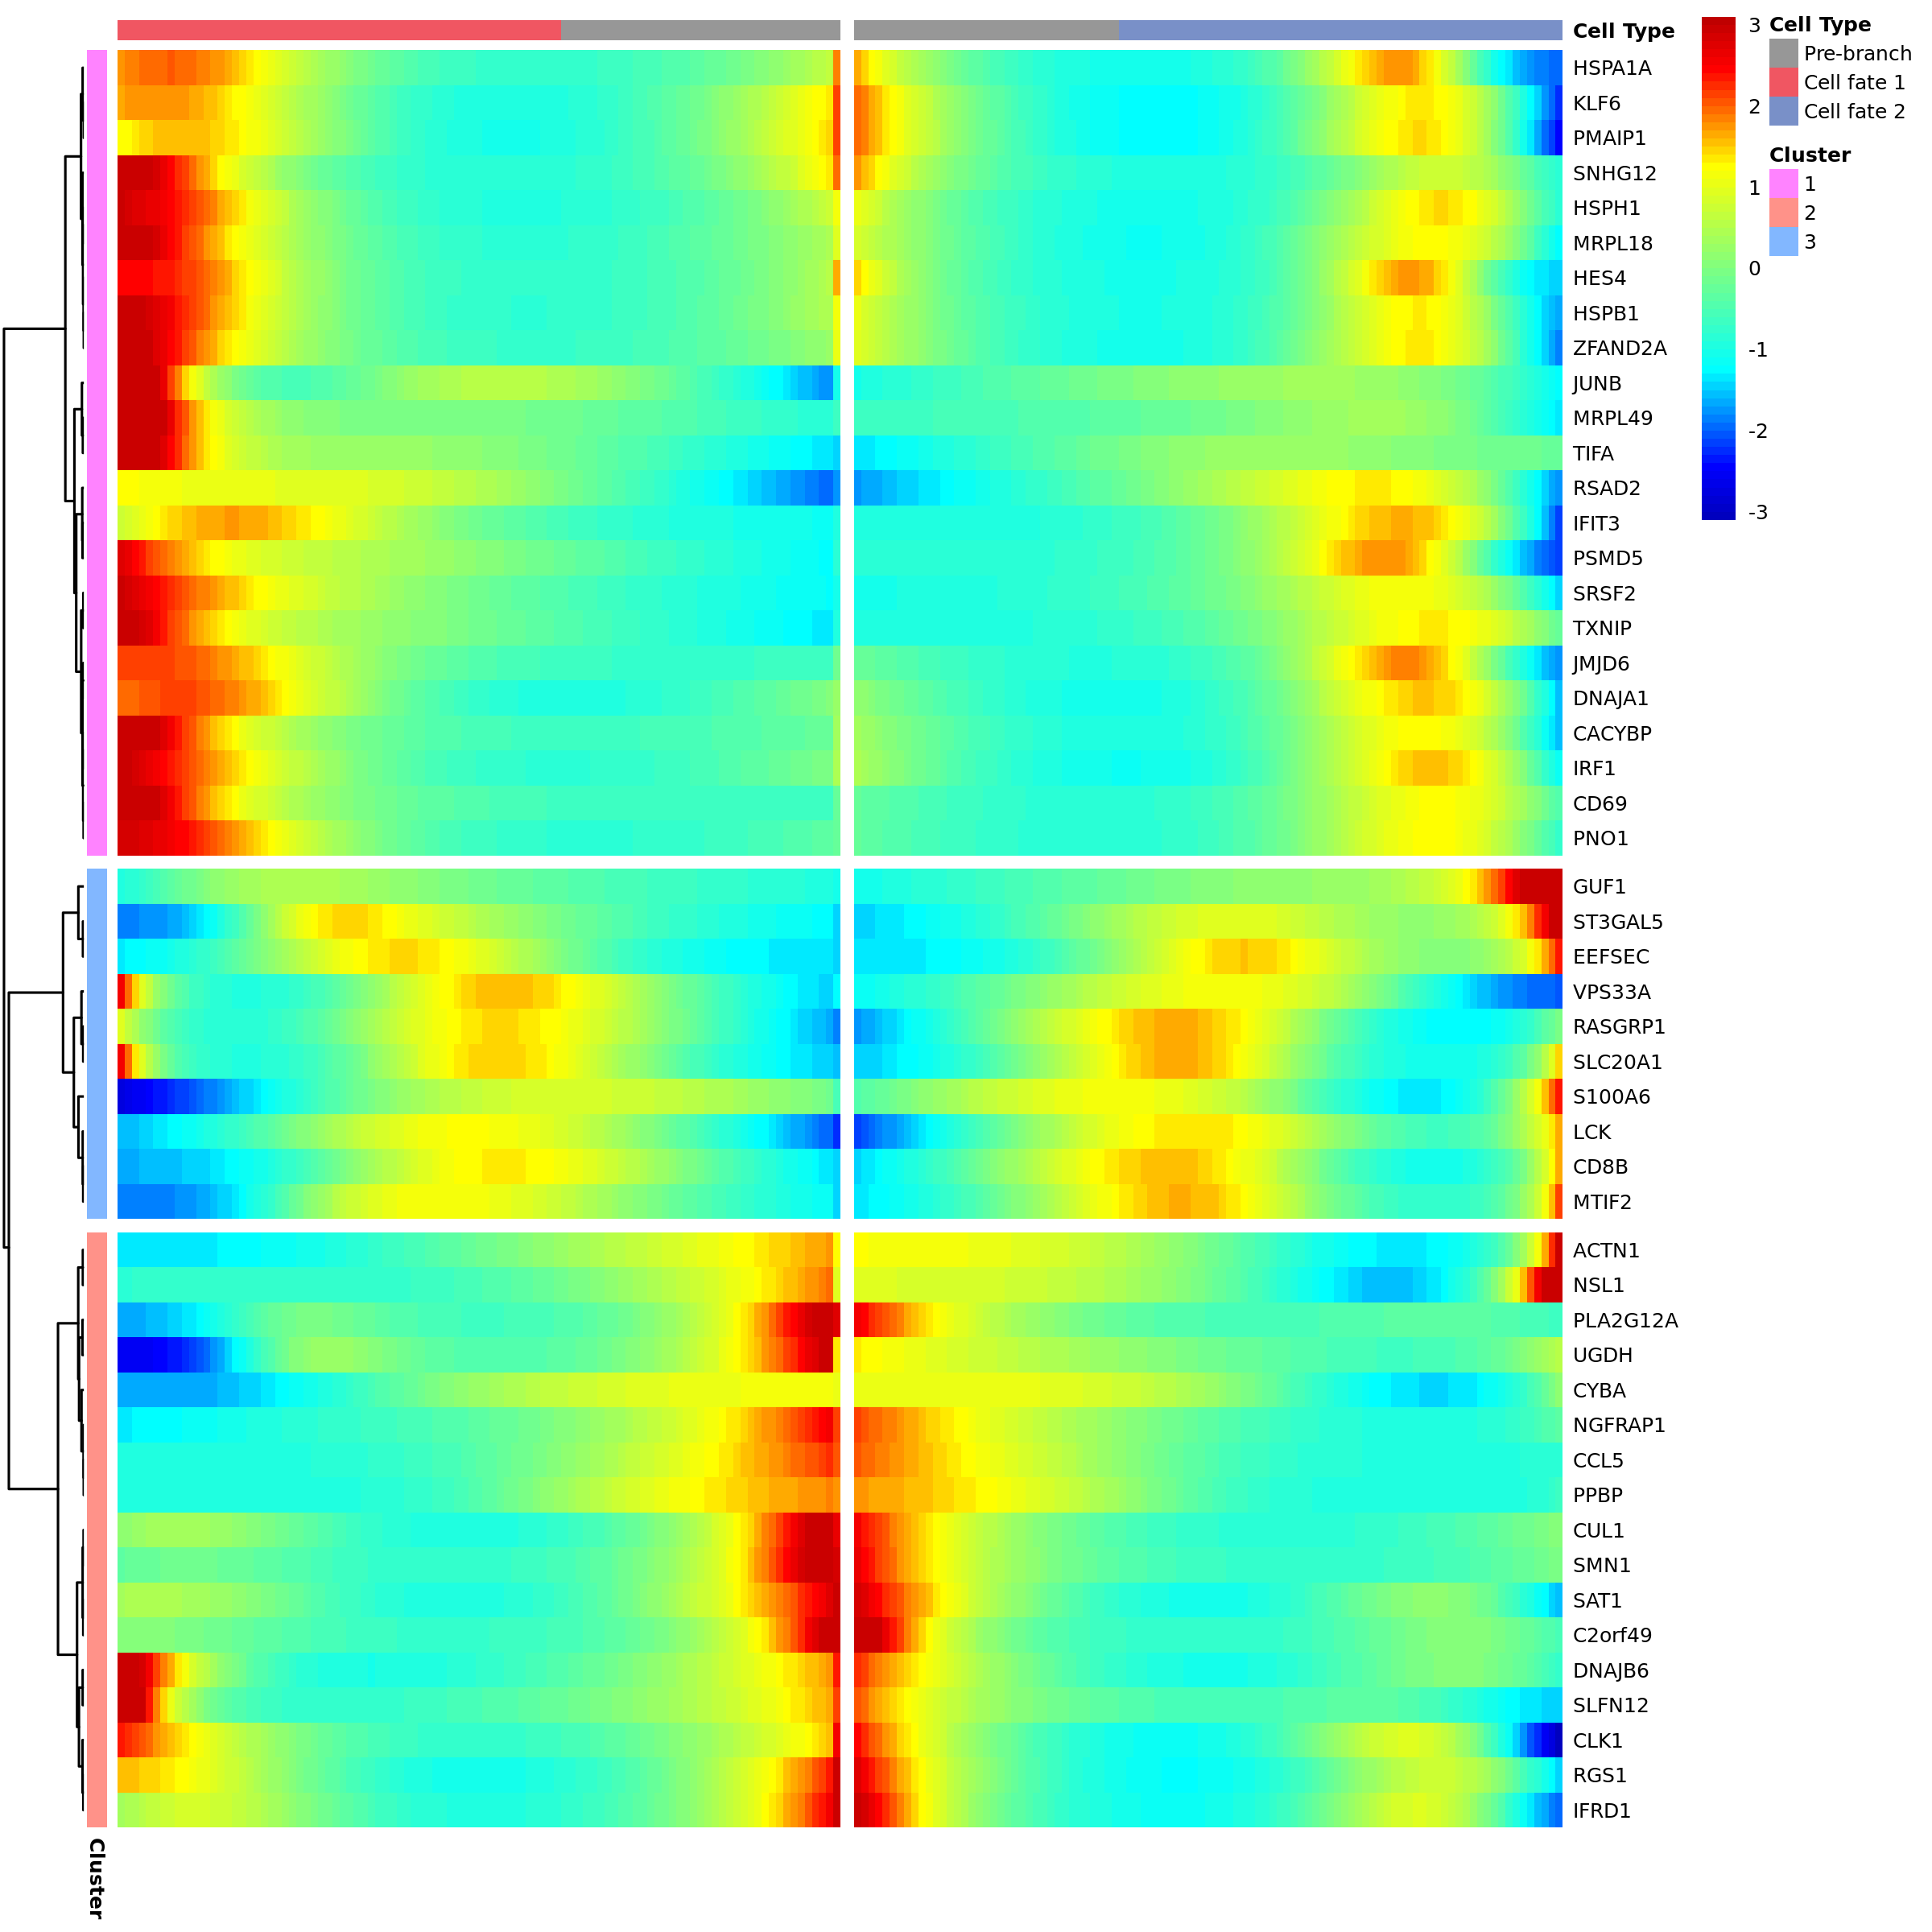
- Chart Interpretation: This heatmap specifically displays genes with significant expression differences when passing through a specific branch point.
- Left gray area: Represents the "precursor" state before branching.
- Middle and right areas: Represent states after cells enter two different branches (Cell Fate 1 and Cell Fate 2), respectively.
- Analysis Points:
- Look for genes that are specifically highly expressed in one branch but lowly expressed in the other. These genes are key factors defining different cell fates.
- For example, in hematopoietic stem cell differentiation, one branch may highly express key transcription factors of the lymphoid lineage, while the other branch highly expresses key transcription factors of the myeloid lineage.
Functional Enrichment Analysis
To understand the functions of different cell states (States) or different gene modules, the report usually provides functional enrichment analysis results, such as GSVA enrichment heatmaps.
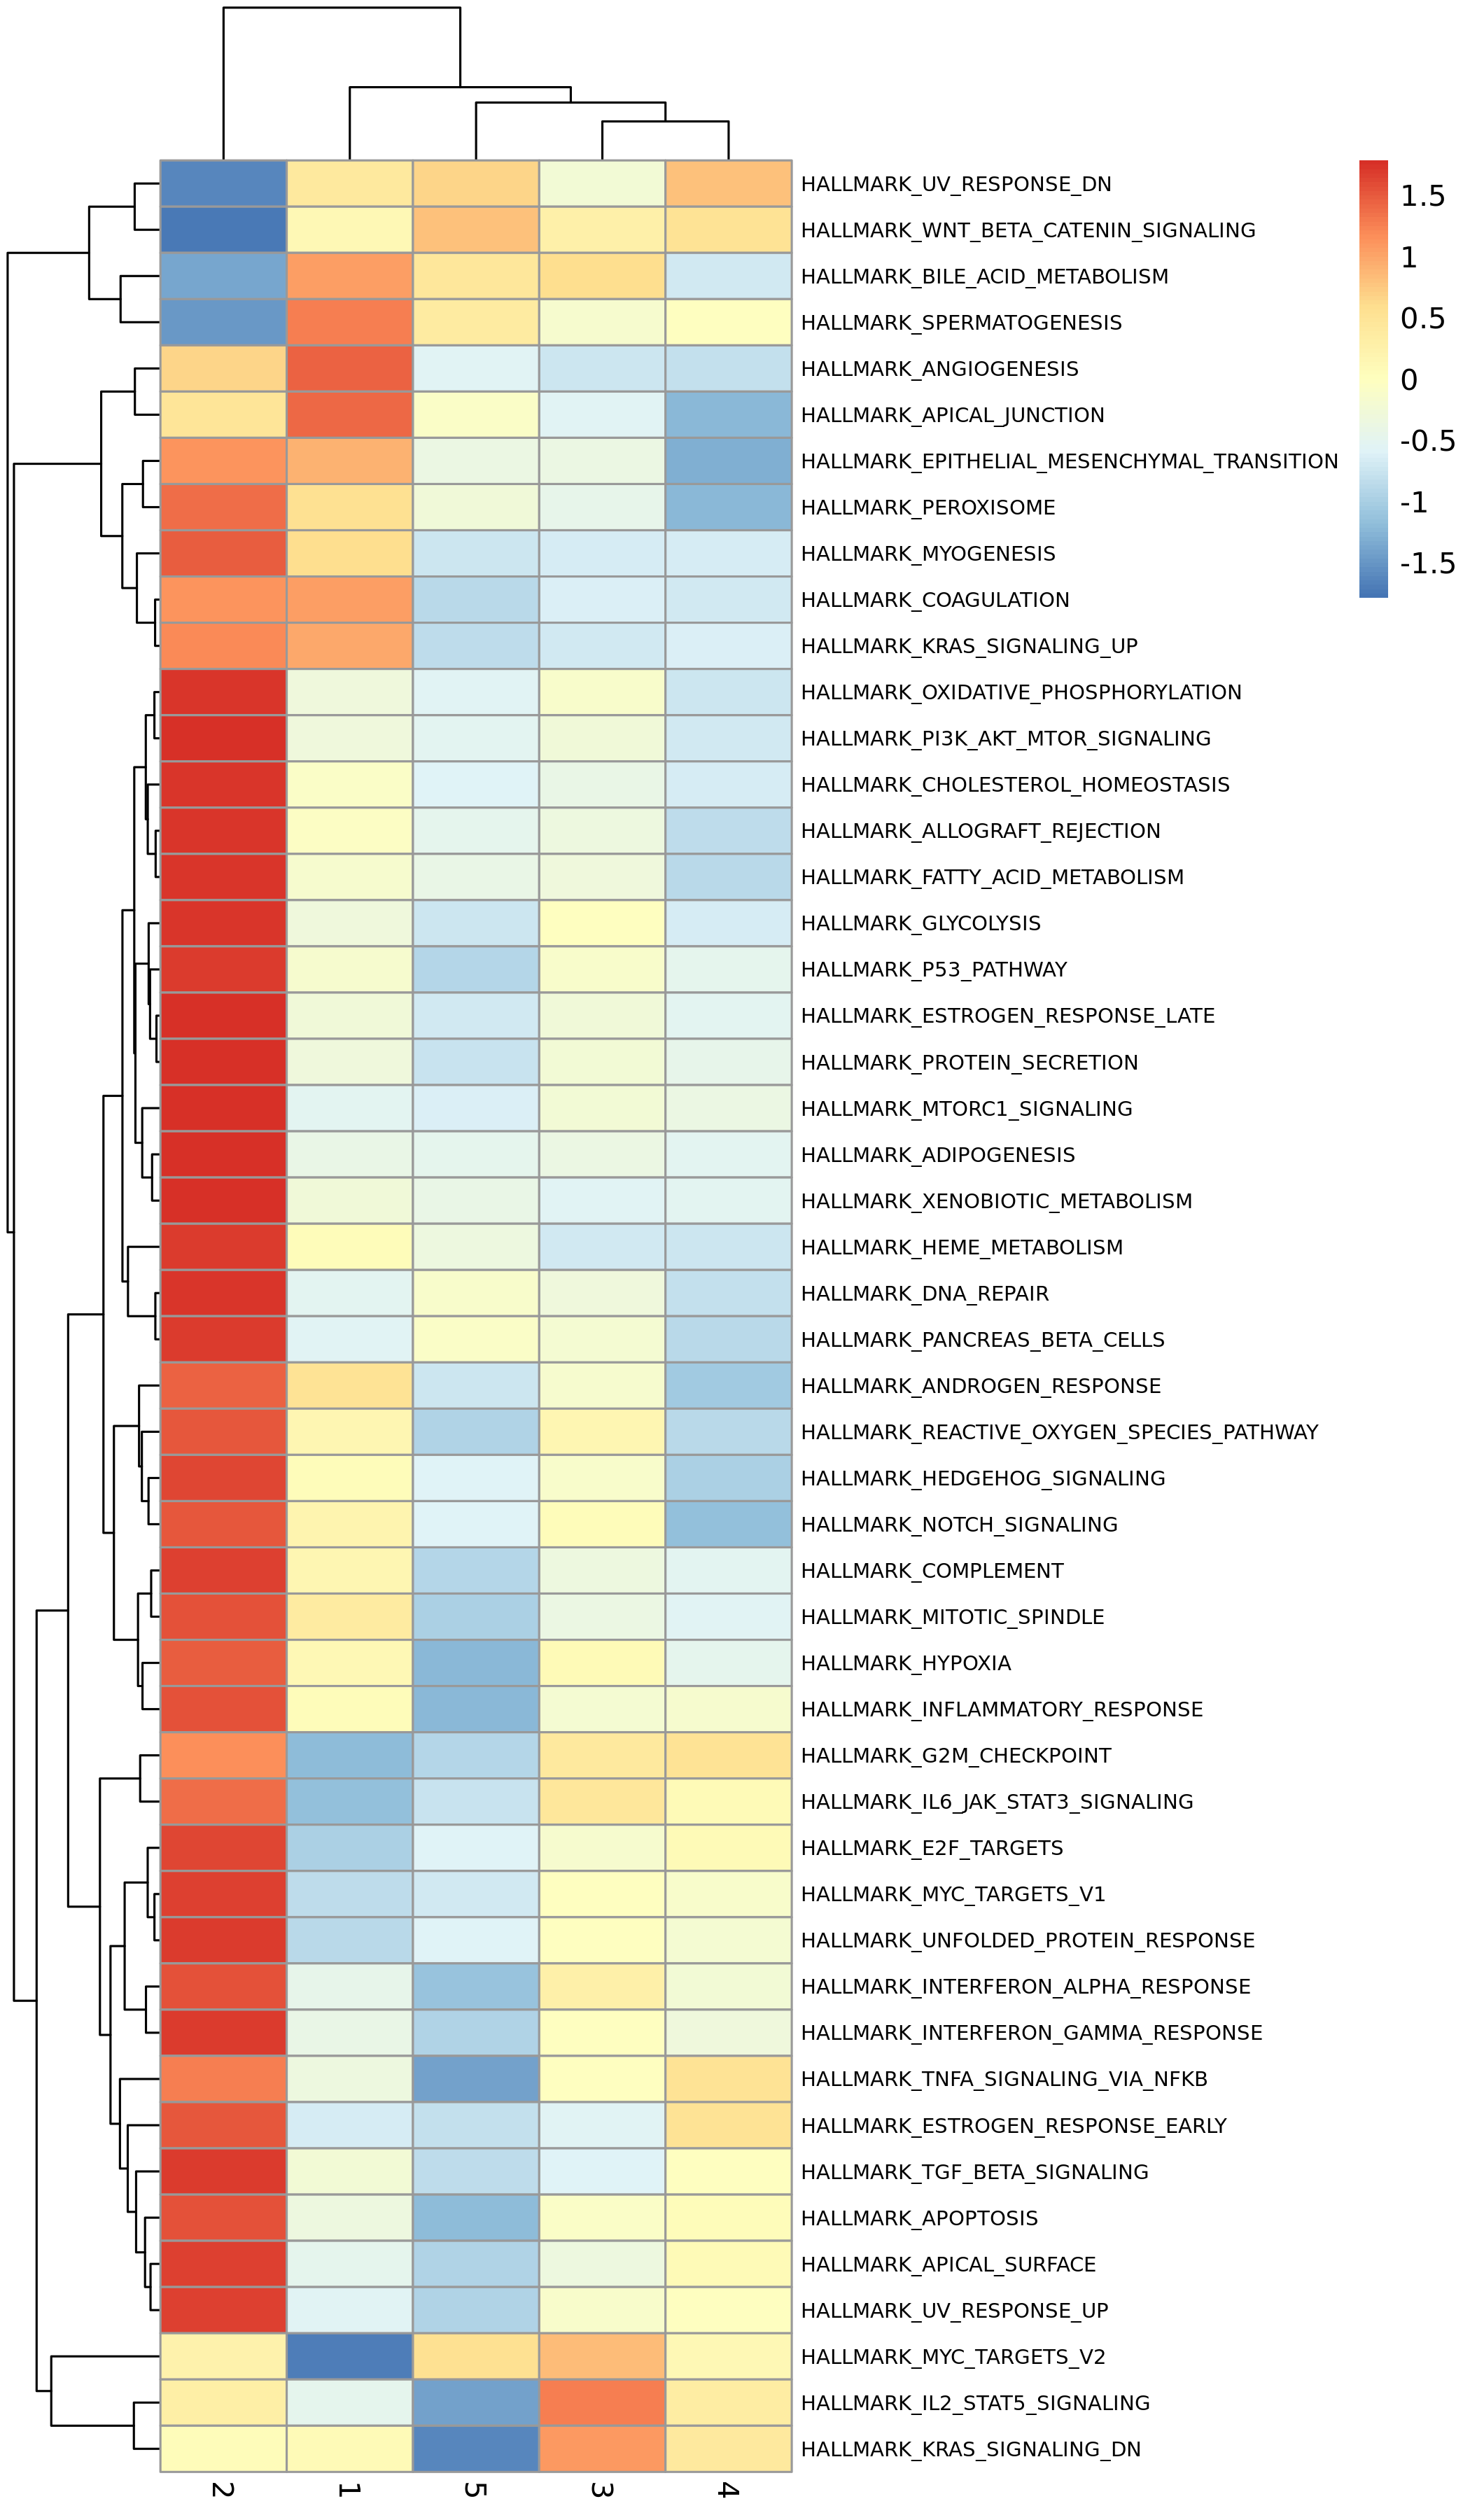
- Chart Interpretation: The heatmap shows enrichment scores of different biological pathways (such as Hallmark pathways) in different States.
- X-axis: Cell states (States).
- Y-axis: Biological pathways.
- Colors: Red indicates high pathway activity, blue indicates low pathway activity.
- Analysis Points:
- Assign biological functions to each State. For example, early developmental States may be enriched in pathways such as "cell cycle" and "DNA repair", while late developmental States may be enriched in pathways related to specific cell functions, such as "interferon gamma response" (immune cells) or "epithelial-mesenchymal transition" (tumor cells).
Result File List
| File Name | Content Description |
|---|---|
cell_Pseudotime.csv | Core data: Contains pseudotime values of each cell and their所属的State. |
ordering_genes_sig_gene_names.all.xls | Core genes: List of all genes that change significantly with pseudotime and their statistical values (p-value, q-value). |
branch*_pseudo_related_gene*.xls | Branch genes: List of genes related to specific branch points found by BEAM analysis. |
*trajectory*.png/pdf | Various cell trajectory maps, including versions colored by Pseudotime, State, celltype, Sample, etc. |
*heatmap*.png/pdf | Expression heatmaps of genes changing with pseudotime or branch genes. |
State/GSVA/ | GSVA enrichment analysis results of various States. |
Application Cases
Case 1: Revealing CD8+ T Cell State Transitions in Recurrent Liver Cancer
- Literature: Sun Y, et al. Cell. 2021.
- Background: Researchers wanted to understand how CD8+ T cells in the tumor microenvironment change in early recurrent hepatocellular carcinoma (HCC).
- Analysis Strategy: Perform pseudotime analysis on CD8+ T cells from primary tumors (PT) and recurrent tumors (RT).
- Core Findings:
- Constructed a complete trajectory of CD8+ T cells from "transitional state" to "exhausted state".
- Found that T cells in recurrent tumors (RT) mainly stay in the early stages of the trajectory, showing low cytotoxicity and high lipid metabolism characteristics.
- While T cells in primary tumors (PT) are more distributed at the end of the trajectory, i.e., cytotoxic or exhausted states.
- Through BEAM analysis and dynamic gene expression change analysis, key transcription factors and checkpoint molecules driving T cell exhaustion were found.
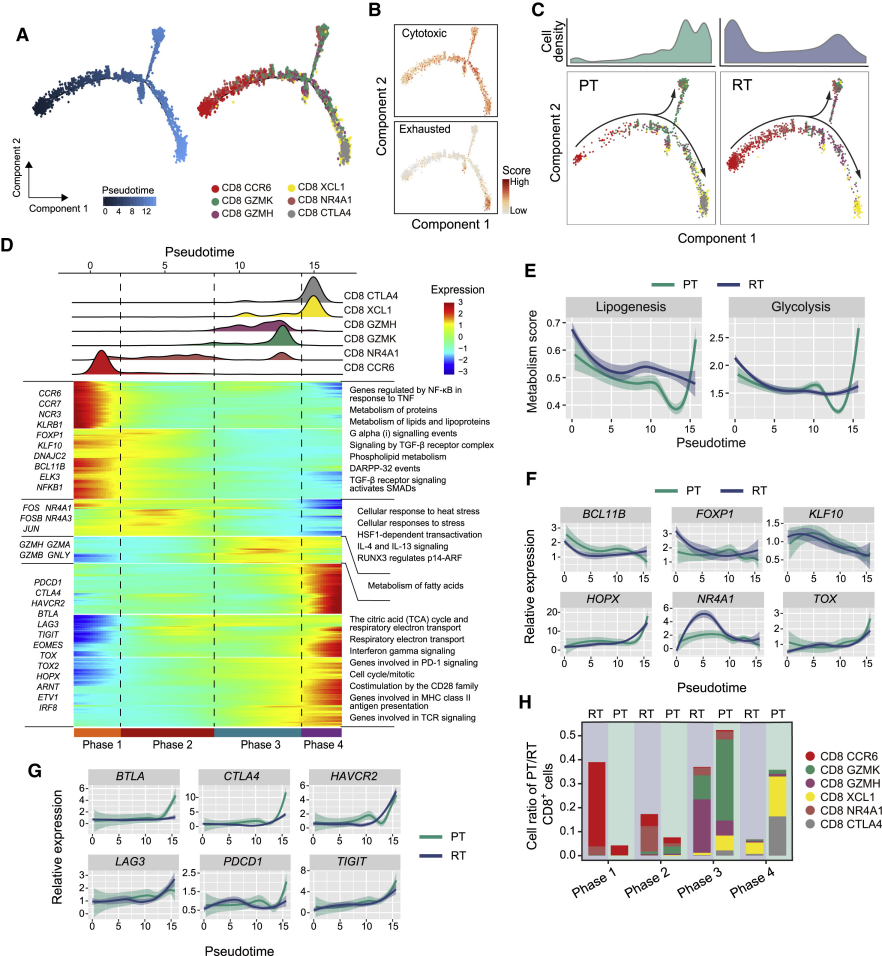
(Figure caption: (A) Pseudotime trajectory of CD8+ T cells in PT and RT samples. (C) Cell density map showing that RT sample cells (blue) are mainly in the early stages of the trajectory, while PT samples (green) are enriched in the late stages.)
Case 2: Mapping Myocardial Cell Atlas of Human Heart Aging
- Literature: Wang L, et al. Nature Cell Biology. 2020.
- Background: Researchers wanted to understand what changes occur in cardiac myocytes (CMs) in the heart during heart failure and recovery.
- Analysis Strategy: Perform pseudotime analysis on cardiac myocytes from the left ventricle (LV) to simulate their "aging" process.
- Core Findings:
- Constructed a pseudotime trajectory of cardiac myocytes from "young" to "old".
- Found that "young" cardiac myocytes highly express genes related to chemokine and cytokine signaling.
- While "old" cardiac myocytes preferentially express genes involved in lipolysis regulation and cGMP-PKG signaling pathway.
- This finding reveals dynamic changes in function and metabolism of cardiac myocytes during heart aging.
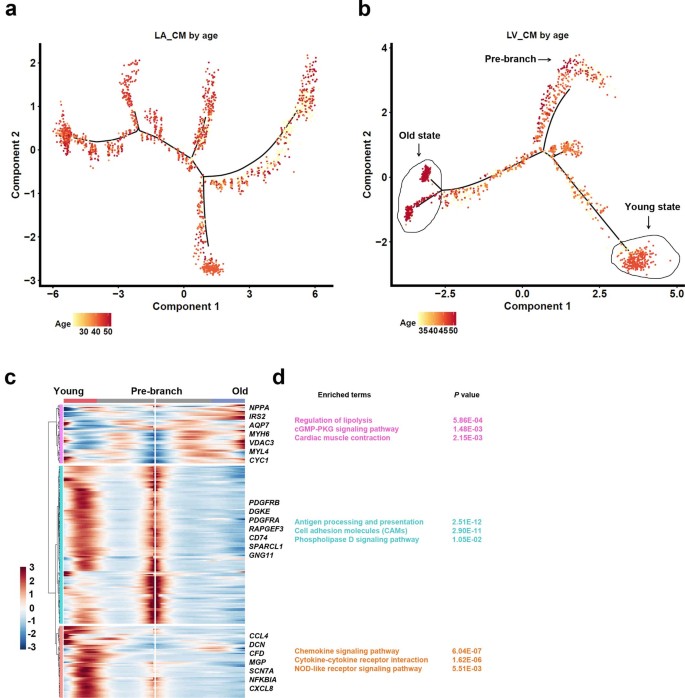
(Figure caption: (b) Pseudotime trajectory of LV cardiac myocytes. (c) Gene expression heatmap changing with pseudotime, revealing functional characteristics at different stages.)
Notes
1. Avoid overinterpretation: Pseudotime trajectories are computational inferences based on transcriptome data, not equal to real cell lineages. Any key findings need to be confirmed by subsequent biological experiments (such as lineage tracing, functional verification).
2. Starting point selection is crucial: The starting point automatically inferred by Monocle2 may be incorrect. Be sure to combine biological knowledge to check and determine the biological starting point of the trajectory through the celltype distribution map, which will directly affect the direction and interpretation of the entire trajectory.
3. Focus on branch points: Branch points in the trajectory are key nodes for cell fate decisions and are rich mining areas for research. The results of BEAM should be analyzed with emphasis to find "switch" genes that drive cells toward different fates.
4. Results are not immutable: The results of pseudotime analysis are affected by upstream analysis (such as clustering and annotation) and analysis parameters (such as selected cell populations, genes used for ordering). If the initial results are not ideal, you can try to adjust the input cell populations or screening criteria for ordering genes and re-analyze.
Frequently Asked Questions (FAQ)
Q1: What exactly do "State" and "Pseudotime" in the figures mean?
A:
- State: Can be understood as "cell states" or "stages" automatically clustered by Monocle2 based on transcriptome similarity. Cells in the same State are highly similar transcriptionally. Paths on the trajectory map connect different States, showing the process of cells transitioning from one state to another.
- Pseudotime: It is not real physical time (hours/days), but an abstract unit measuring how "far" cells have "traveled" on the differentiation path. A smaller pseudotime value means the cell is closer to the starting point of the trajectory (more primitive); a larger pseudotime value means the cell is closer to the end point (more differentiated). By analyzing changes in gene expression with pseudotime, key genes playing roles in the differentiation process can be found.
Q2: How to determine which State is the starting point and which is the end point?
A: Determining the starting point is key to result interpretation. Please follow these steps:
- Use prior knowledge: Check the
cell_trajectory_celltype.pngfigure, find the cell type you know to be the most "primitive" biologically (such as stem cells, naive cells, control group cells), observe the State where they are mainly enriched, which is the starting point. The State where terminally differentiated cell types are located is the end point. - Verify with CytoTRACE: The cell population with the highest CytoTRACE score theoretically corresponds to the starting point of the trajectory.
Q3: What is BEAM analysis? What is its relationship with the main trajectory map?
A:
- BEAM (Branched Expression Analysis Modeling) is a module in Monocle2 specifically used to analyze branch points. When your trajectory has branches, it means cells make "fate decisions" here.
- Function: BEAM analysis can identify genes with the most significant dynamic changes before and after branch points. These genes are usually key drivers regulating cells toward different differentiation fates.
- Relationship with the main trajectory map: The main trajectory map macroscopically shows the path of "where to come from and where to go"; while BEAM analysis focuses on the micro question of "what genes determine which path to take at the crossroads". It is an important step for in-depth mechanism exploration after obtaining the main trajectory map.
Q4: How are ordering genes selected? Why are they so important?
A: Ordering genes are the cornerstone of Monocle2 trajectory construction, and their correct selection is the most critical step to obtain biologically meaningful results. Monocle2 infers the sequence of cells by observing the expression change patterns of these genes between cells. If genes are selected inappropriately, the trajectory will not reflect real biological processes.
The platform provides three strategies for selecting ordering genes:
| Parameter Option | Principle | How It Affects Results | Applicable Scenarios |
|---|---|---|---|
dispersion (platform default) | Highly Variable Genes: Select genes with the largest expression level changes in all cells. This is an unsupervised method that assumes genes with the most dramatic expression changes are most likely related to cell state transitions. | - Advantages: No need to predefine cell populations, can perform exploratory analysis, may discover unexpected trajectories. - Disadvantages: If there are strong technical noise (such as batch effects) or biological processes you don't care about (such as cell cycle) in the data, highly variable genes related to these processes may dominate trajectory construction, masking the processes you really care about. | Most commonly used and general method. Suitable for most exploratory studies, especially when you don't have a clear target for cell state transitions or specific functional gene sets. |
differential | Differential Genes: Select genes that are differentially expressed between different pre-defined cell groups (usually cell types or clusters). | - Advantages: Can focus on genes related to specific cell state transitions, reducing the impact of unrelated biological processes. - Disadvantages: Requires pre-defined cell groups, which may introduce bias. | Suitable when you have clear cell type annotations and want to focus on the transition between specific cell types (such as from naive T cells to effector T cells). |
genelist | Custom Genes: Use a set of genes of interest defined by you, usually genes from specific signaling pathways or regulatory networks. | - Advantages: Can directly explore the role of genes of interest in cell state transitions, with strong targeting. - Disadvantages: Requires prior knowledge of the genes of interest; if the selected genes are not representative, it may lead to incorrect trajectory construction. | Suitable when you have clear biological hypotheses, such as exploring the role of specific signaling pathways (such as Wnt, Notch) in cell differentiation, or when you have a set of genes that are known to be related to the biological process of interest. |
Q5: Why do I need to specify "Group.by" and "Cell Type"?
A: These two parameters are used to select the cell population for analysis. Here's their specific role:
Group.by: First, you need to tell the platform which metadata column contains the cell type or cluster information you want to use. For example, if your metadata has a column named
celltypethat contains annotations like "T cell", "B cell", "Macrophage", then you should selectcelltypehere.Cell Type: After selecting
Group.by, you need to further specify which specific cell types to include in the analysis. For example, if you only want to analyze T cell differentiation, you can select all T cell subtypes here (such as CD4+ T, CD8+ T, etc.).
This design ensures that you only analyze cell populations with potential differentiation relationships, avoiding including irrelevant cells that may interfere with trajectory construction. It is very important to select the right cell population. If you include cells that are biologically unrelated (such as T cells and epithelial cells), the resulting trajectory will not have meaningful biological interpretation.
Q6: How to properly use the "Downsample" parameter?
A: The Downsample parameter is mainly designed to handle large datasets, especially when the total number of cells exceeds 50,000 or more. Here are some suggestions for its use:
When to enable: If your analysis task fails due to memory overflow error, or if the analysis process is extremely slow (taking more than 24 hours), you should consider enabling downsampling.
How to set
Downsample_num: This parameter determines how many cells are retained in each cell subpopulation after downsampling. Generally speaking, for most biological questions, retaining 2,000-5,000 cells is sufficient to capture the main trajectory structure. However, the specific value should be adjusted according to your data characteristics:- If the cell population is very heterogeneous, a larger value (such as 5,000-10,000) may be needed.
- If the cell population is relatively homogeneous, a smaller value (such as 1,000-2,000) may be sufficient.
Potential impacts: Downsampling can speed up analysis and reduce memory usage, but it may also lose some rare cell types or subtle differences in gene expression. If your research focuses on rare cell subpopulations, downsampling should be used with caution, or a larger
Downsample_numshould be set to ensure these rare cells are retained.
Q7: What should I do if the trajectory result doesn't match my biological expectations?
A: If the initial trajectory result doesn't match your biological expectations, you can try the following adjustment strategies:
Recheck the cell population: Ensure that the selected cell population has potential differentiation relationships. If you include irrelevant cells, remove them and re-analyze.
Adjust ordering gene selection: Try different strategies for selecting ordering genes. For example, if you used
dispersion(highly variable genes) and got unsatisfactory results, you can trydifferential(differential genes) or a custom gene list.Modify gene filtering thresholds: For example, in
dispersionmode, adjustMean_expressionandDispersion_empiricalto include more or fewer genes. A more stringent threshold may reduce the impact of noise.Re-define the starting point: If the automatically inferred starting point is incorrect, use "Analysis Based on Historical Results" to modify the root (starting point) and re-analyze.
Check upstream analysis results: The quality of clustering and cell type annotation directly affects pseudotime analysis. If the upstream analysis results are unreliable, you need to re-perform quality control, dimensionality reduction, clustering, and annotation.
Pseudotime analysis is an exploratory process, and adjusting parameters multiple times to obtain biologically meaningful results is a normal phenomenon. Remember that the final evaluation criterion is whether the results are consistent with your biological knowledge and hypotheses.
Q8: How to extract genes that change with pseudotime for further analysis?
A: You can find genes that change with pseudotime in the result files:
Core result file:
ordering_genes_sig_gene_names.all.xlscontains all genes that change significantly with pseudotime, along with their p-values and q-values.Extraction method: You can sort genes according to q-values (smaller q-values indicate more significant changes), and then select the top genes (such as top 100, top 500) for further analysis.
Further analysis: These genes can be used for:
- Functional enrichment analysis to understand biological processes involved in differentiation.
- Regulatory network analysis to find key transcription factors driving differentiation.
- Experimental verification (such as qPCR, single-cell RNA FISH) to confirm their expression patterns.
Q9: Can I perform Monocle2 analysis on non-human species data?
A: Yes, the platform supports Monocle2 analysis of non-human species data. When configuring parameters, select the corresponding species (such as Mouse, Rat, Zebrafish, etc.). However, it should be noted that:
Gene annotation: For some non-model organisms, gene annotation information may not be as comprehensive as that of humans and mice, which may affect the results of functional enrichment analysis.
Custom gene list: If you use a custom gene list for ordering, ensure that the gene names are consistent with the gene names in your input data.
Q10: What is the relationship between Monocle2 and other pseudotime analysis tools (such as Monocle3, Slingshot, Palantir)?
A: Monocle2 is a representative tool in the field of pseudotime analysis, but there are also other excellent tools:
Monocle3: The successor to Monocle2, with improved algorithms and more features, such as support for RNA velocity and spatial transcriptomics data.
Slingshot: A tool based on smooth curves, which can handle complex trajectory structures and support multiple starting points.
Palantir: A tool based on Markov processes, which can predict cell fate probabilities and identify branch points.
Different tools have different algorithm principles and applicable scenarios. The choice of tool depends on your research questions and data characteristics. Monocle2 is still widely used due to its mature algorithms and easy-to-interpret results, especially in the analysis of branching trajectories.
In practical applications, you can also try to compare the results of multiple tools to verify the reliability of your findings.
References
[1] TRAPNELL C, CACCHIARELLI D, GRIMSBY J, et al. The dynamics and regulators of cell fate decisions are revealed by pseudo-temporal ordering of single cells[J]. Nature biotechnology, 2014, 32(4): 381-386.
[2] QIU X, HILL A, PACKER J, et al. Single-cell mRNA quantification and differential analysis with Census[J]. Nature methods, 2017, 14(3): 309-315.
[3] SUN Y, WU L, ZHONG Y, et al. Single-cell landscape of the ecosystem in early-relapse hepatocellular carcinoma[J]. Cell, 2021, 184(2): 404-421.
[4] WANG L, YU P, ZHOU B, et al. Single-cell reconstruction of the adult human heart during heart failure and recovery reveals the cellular landscape underlying cardiac function[J]. Nature cell biology, 2020, 24(1): 1-13.